CO2_inhalation pipeline
Cerebrovascular reactivity (CVR) evaluation under CO2 challenge
Functional magnetic resonance imaging (fMRI) experiments to assess cerebrovascular reactivity (CVR) to hypercapnia (increased CO2 levels) typically involve inducing controlled changes in CO2 levels while measuring the resulting changes in brain activity.
Hypercapnia is induced by administering a gas mixture containing higher than normal levels of CO2 (typically around 8% CO2). This can be achieved using a gas delivery system within the MRI scanner. Participants breathe the gas mixture through a mask or a respiratory apparatus.
While hypercapnia is induced, fMRI data is continuously acquired to capture changes in blood oxygenation level-dependent (BOLD) signals, which reflect changes in cerebral blood flow.
Throughout the experiment, physiological parameters such as end-tidal CO2 (ETCO2) levels, heart rate, and respiratory rate are monitored to ensure the effectiveness of hypercapnia induction and to account for potential confounding effects. Trigger and physiological data are used together to ensure that ETCO2 data are synchronized with imaging data.
The fMRI data are analyzed using a GLM approach. An ETCO2 regressor is included in the model to account for variations in CO2 levels. Other potential confounding variables (e.g. motion parameters) are also included as regressors.
A report is generated at the end of the analysis with the main statistical results obtained.
Test this pipeline : use the sub-001 from mia_data_users.
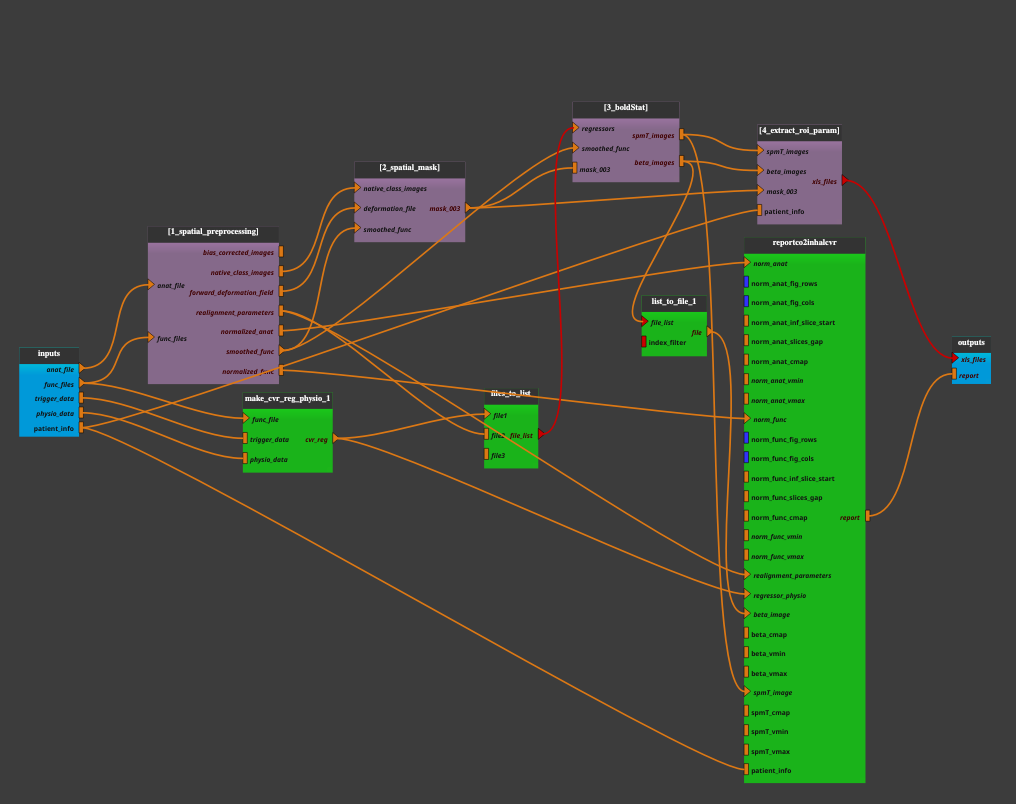
Pipeline insight
- The CO2_inhalation pipeline combines the following bricks:
Inputs parameters
- anat_file
An anatomical image (ex. 3D T1 sequence such as T1 turbo field echo). An existing, uncompressed file (valid extensions: [.img, .nii, .hdr]).
ex. '/home/username/data/raw_data/sub-001-ses-01--2-CS_T13DEG-T1TFE-153355_910000.nii'
- func_files
Functional images (ex. 4D T2* sequence such as echo planar imaging). A list of items which are an existing, uncompressed file (valid extensions: [.img, .nii, .hdr]).
ex. ['/home/username/data/raw_data/sub-001-ses-01--1-FE_EPI_32chSHC-FEEPI-153814_370000.nii']
- trigger_data
The trigger data, to ensure that ETCO2 data (physiological data) are synchronized with imaging data. An existing file, exclusively in [.txt, .csv, .log] format.
ex. '/home/username/data/downloaded_data/sub-001_ses-01_task-cvr_trigger.log'
- physio_data
The physiological data, including ETCO2 levels, measured during the neuroimaging scan. An existing file, exclusively in [.txt, .csv] format.
ex. '/home/username/data/downloaded_data/sub-001_ses-01_task-cvr_coolterm.txt'
- patient_info
- A dictionary for entering patient data.
PatientRef: the patient’s code name
Pathology: the patient’s pathology
Age: patient’s age
Sex: patient’s sex
MR: MR-imager used,
Gas: Stimulation gas: Carbogen, Bactal, Variocap, etc.
GasAdmin : Stimulation gas administration: Mask, Cannula, etc.
ex. {'PatientRef': 'sub-001', 'Pathology': 'ACMD', 'Age': 57,
     'Sex': 'F', 'MR': '3T', 'Gas': 'Bactal', 'GasAdmin': 'Mask'}
- display_convention (a string, optional, default value is ‘radiological’)
The display convention used for the anatomical and functional images in the report. It can be either ‘neurological’ or ‘radiological’.
ex. neurological
Outputs parameters:
- xls_files
A tab-delimited text file containing a summary of the statistical results obtained (e.g. laterality indices, mean values, standard deviations, etc.) in the regions of interest.
ex. ['/home/username/data/derived_data/PatientRef_data/results_aggregation/BOLD_IL_mean_spmT.xls',
     '/home/username/data/derived_data/PatientRef_data/results_aggregation/BOLD_std_beta.xls',
     '/home/username/data/derived_data/PatientRef_data/results_aggregation/BOLD_IL_std_beta.xls',
     '/home/username/data/derived_data/PatientRef_data/results_aggregation/BOLD_mean_spmT.xls',
     '/home/username/data/derived_data/PatientRef_data/results_aggregation/BOLD_mean_beta.xls',
     '/home/username/data/derived_data/PatientRef_data/results_aggregation/BOLD_IL_mean_beta.xls',
     '/home/username/data/derived_data/PatientRef_data/results_aggregation/BOLD_std_spmT.xls',
     '/home/username/data/derived_data/PatientRef_data/results_aggregation/BOLD_IL_std_spmT.xls']
- report
The output generated report (.pdf). The summary of analysis, including laterality indices in various territories for statistical results (beta coefficients and t-statistical values, derived from GLM) plots.
ex. '/home/username/data/derived_data/sub-001_CO2_inhal_CVR_Report_2024_03_19_11_01_15_04.pdf'