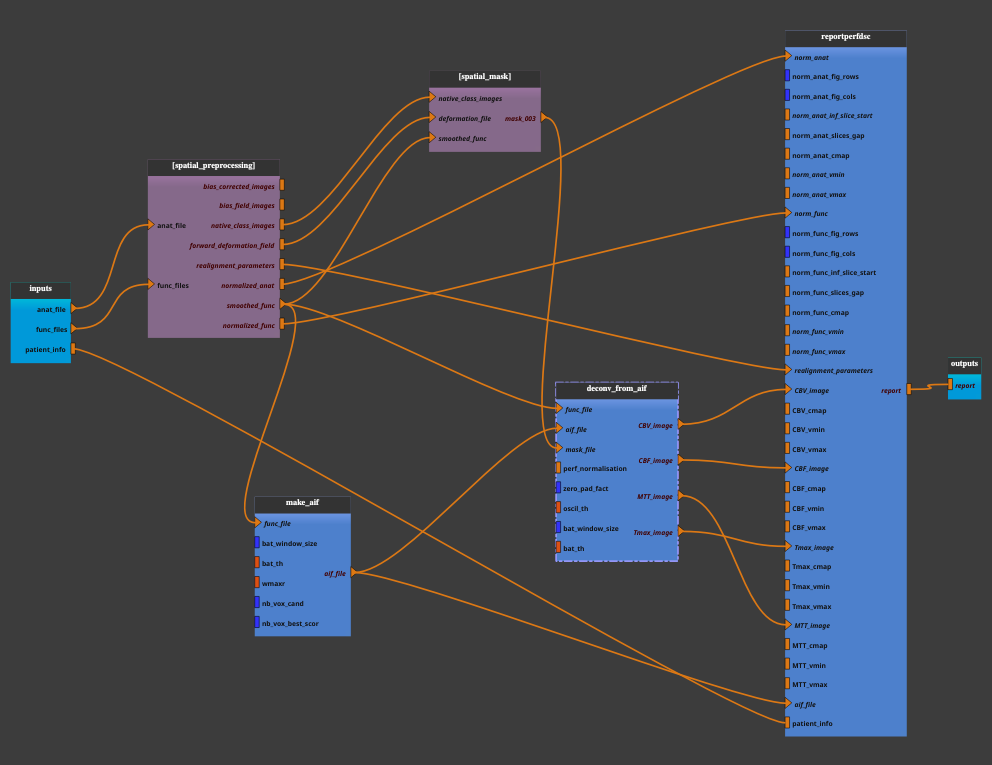
Perfdsc pipeline
Perfusion Dynamic Susceptibility Contrast MRI
Perfusion DSC (Dynamic Susceptibility Contrast) MRI is a widely used imaging technique in clinical and research settings to measure cerebral perfusion, which refers to the flow of blood through the brain’s vasculature.
It involves the injection of a contrast agent (usually gadolinium-based) and rapid imaging to track the passage of this contrast through the blood vessels. This typically involves echo-planar imaging (EPI) sequences. As the contrast agent passes through the blood vessels, it creates local magnetic field inhomogeneities, leading to changes in the MR signal.
The acquired data are processed to generate various perfusion maps, such as:
Cerebral Blood Volume (CBV): Indicates the volume of blood within a given amount of brain tissue.
Cerebral Blood Flow (CBF): Measures the rate at which blood is delivered to brain tissue.
Mean Transit Time (MTT): The average time it takes for the contrast agent to pass through the brain’s vasculature.
Time to Peak (TTP): The time it takes for the contrast agent concentration to reach its maximum in the tissue.
Test this pipeline : use the sub-001 from mia_data_users.
Pipeline insight
- The Perfdsc pipeline combines the following pipelines and processes:

Inputs parameters
- anat_file
An anatomical image (ex. 3D T1 sequence such as T1 turbo field echo). An existing, uncompressed file (valid extensions: [.img, .nii, .hdr]).
ex. '/home/username/data/raw_data/sub-001-ses-01--2-CS_T13DEG-T1TFE-153355_910000.nii.nii'
- func_files
Functional images (ex. 4D T2* sequence such as echo planar imaging). A list of items which are an existing, uncompressed file (valid extensions: [.img, .nii, .hdr]).
ex. ['/home/username/data/raw_data/sub-001-ses-01--0-PERFUSION-FEEPI-155640_450000.nii']
- patient_info
- A dictionary for entering patient data.
PatientRef: the patient’s code name
Pathology: the patient’s pathology
Age: patient’s age
Sex: patient’s sex
MR: MR-imager used
ex. {'PatientRef': 'sub-001', 'Pathology': 'ACMD', 'Age': 57, 'Sex': 'F', 'MR': '3T'}
Outputs parameters:
- report
The output generated report (.pdf). The summary of analysis, including CBV, CBF, TTP and MTT plots.
ex. '/home/username/data/derived_data/sub-001_Perf_DSC_Report_2024_10_23_06_11_12_36.pdf'